Telemetry
Telemetry features in reef-pi allow users to capture, visualize and alert on sensor or controller health data. Telemetry functionality help in avoiding tank accidents due to equipment failure (such as a bad heater cooking up a reef tank) or to understand long-term trends in tank parameters. This guide will walk through the basic telemetry features and how to configure them. This guide assumes you have a running reef-pi controller already. Follow the general guides first if you do not have a working reef-pi installation.
Sending telemetry data to adafruit.io
reef-pi allows emitting telemetry data to adafruit.io. The data can be used to visualize trends for longer periods (a month or two) over the internet (i.e. even outside home wifi where reef-pi UI is not accessible). Unlike the built-in dashboard, this data is persistent and does not go away when the controller is powered off. Following are the steps to setup Adafruit.io integration:
Visit Adafruit.io and sign up for an account.
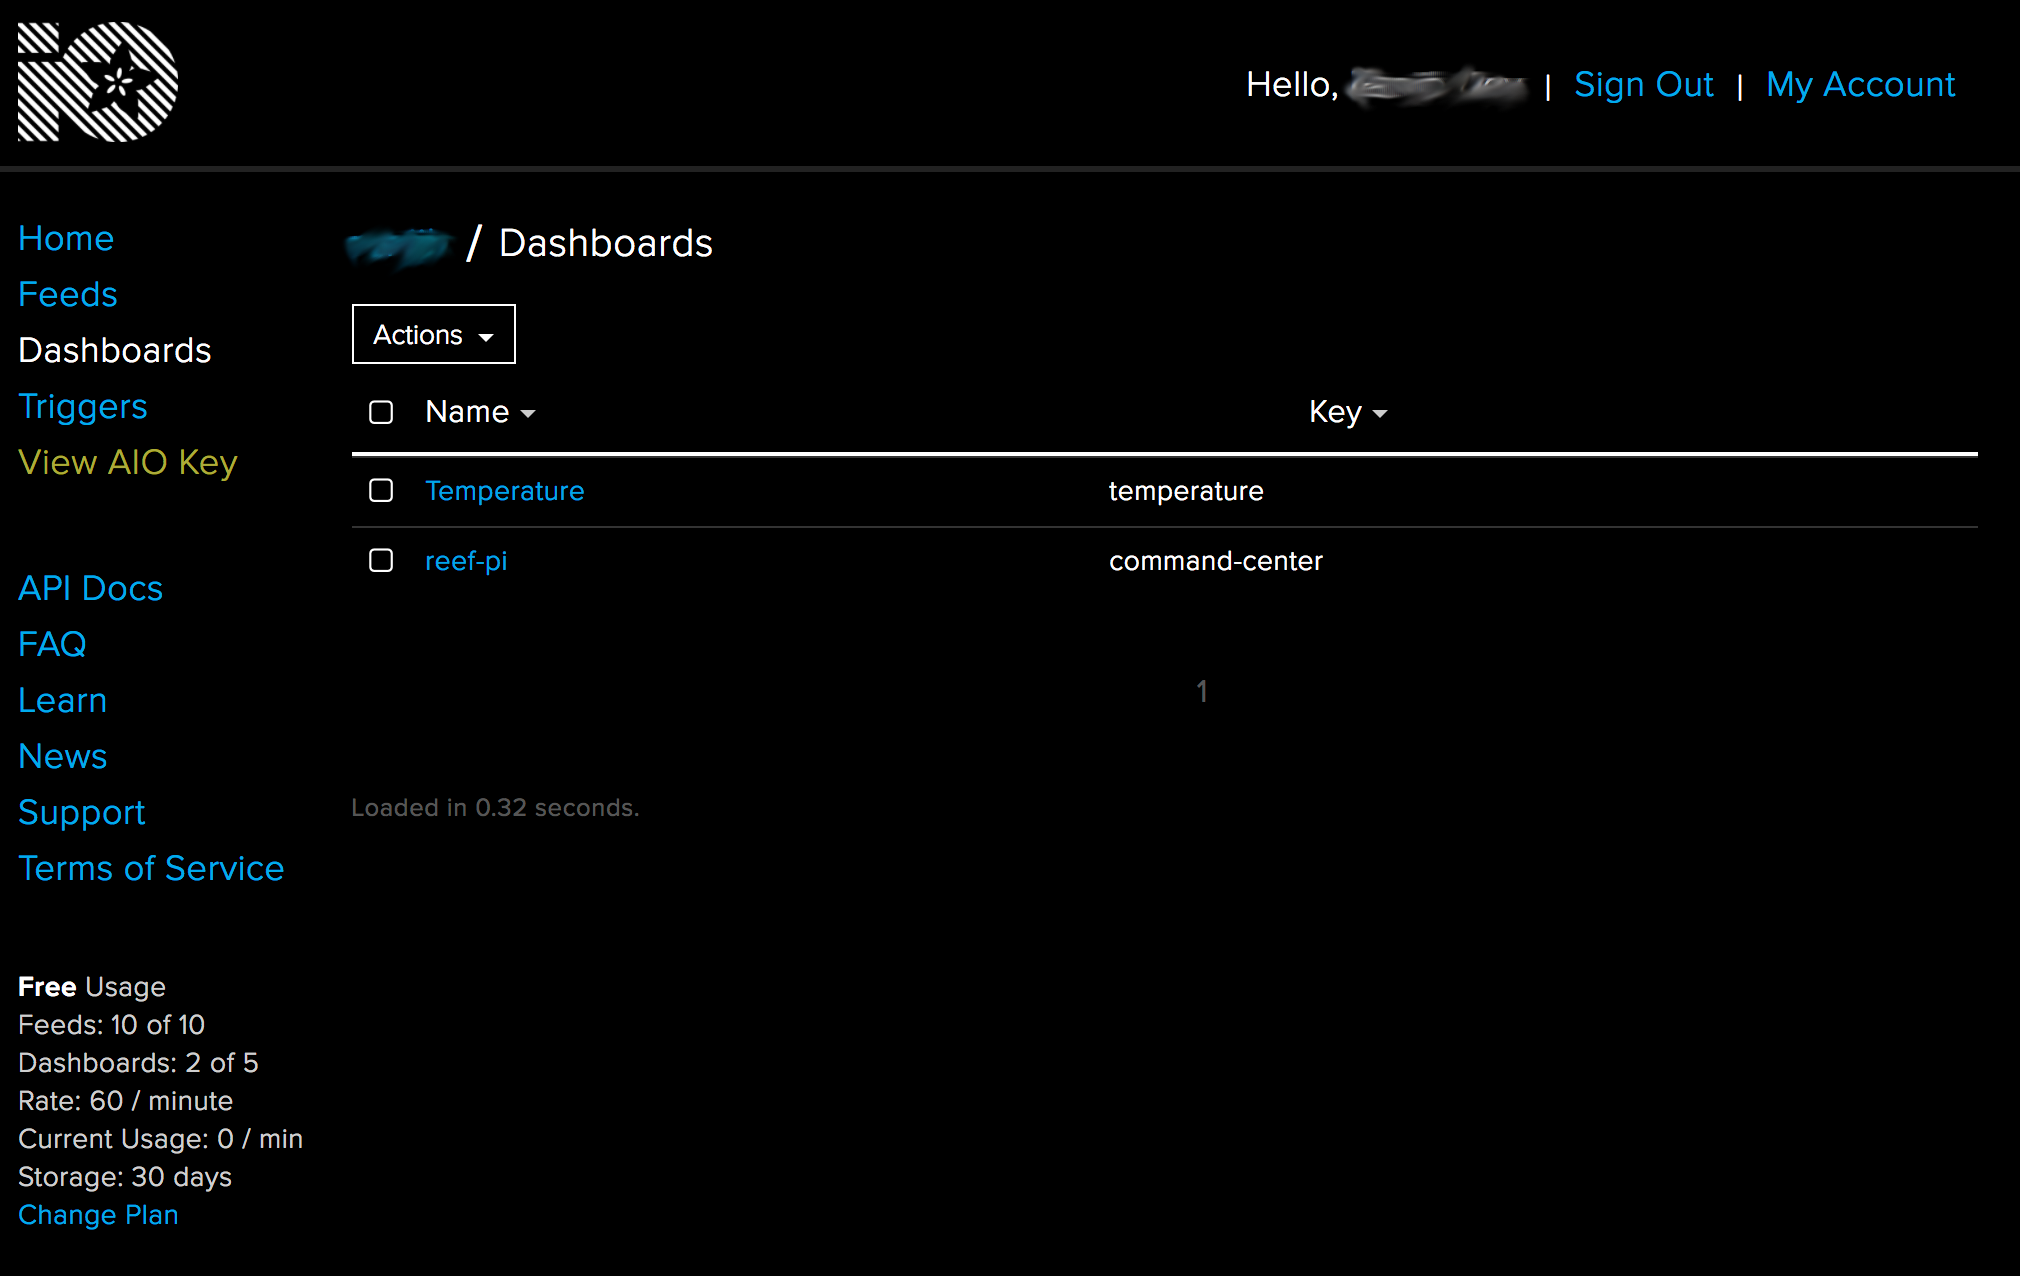
Once you have an account, click on View AIO Key link on left panel to obtain your username and AIO Key
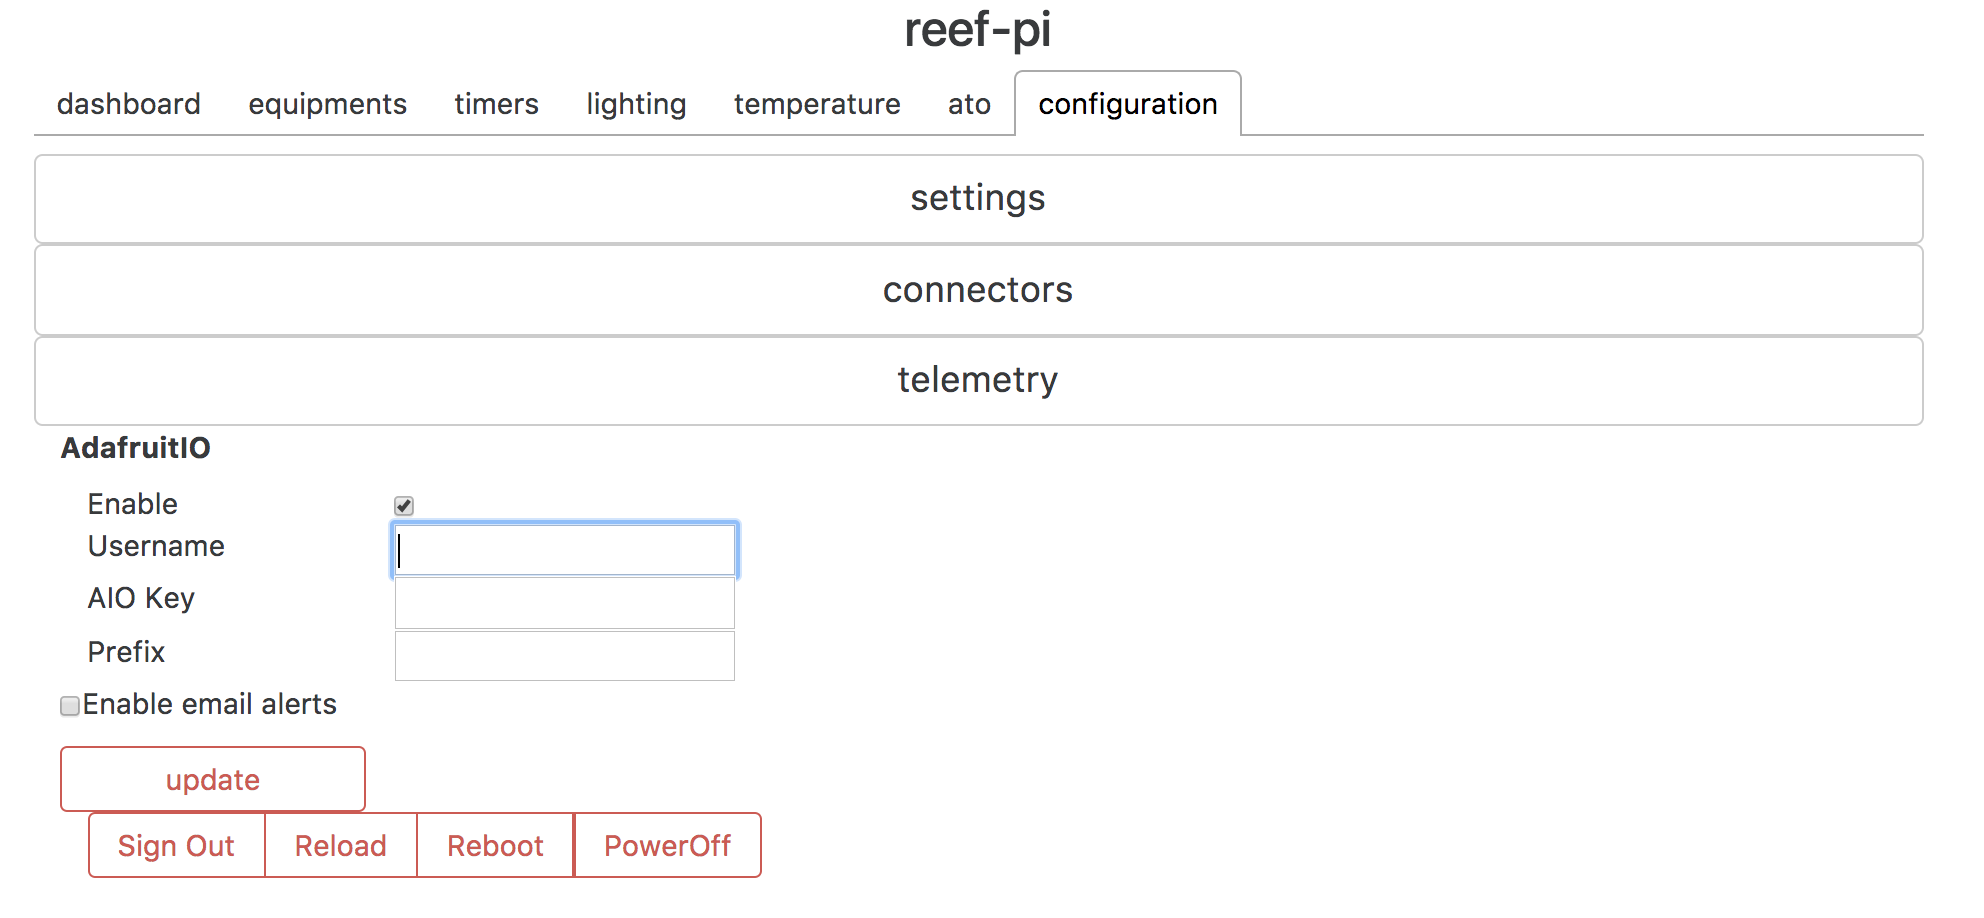
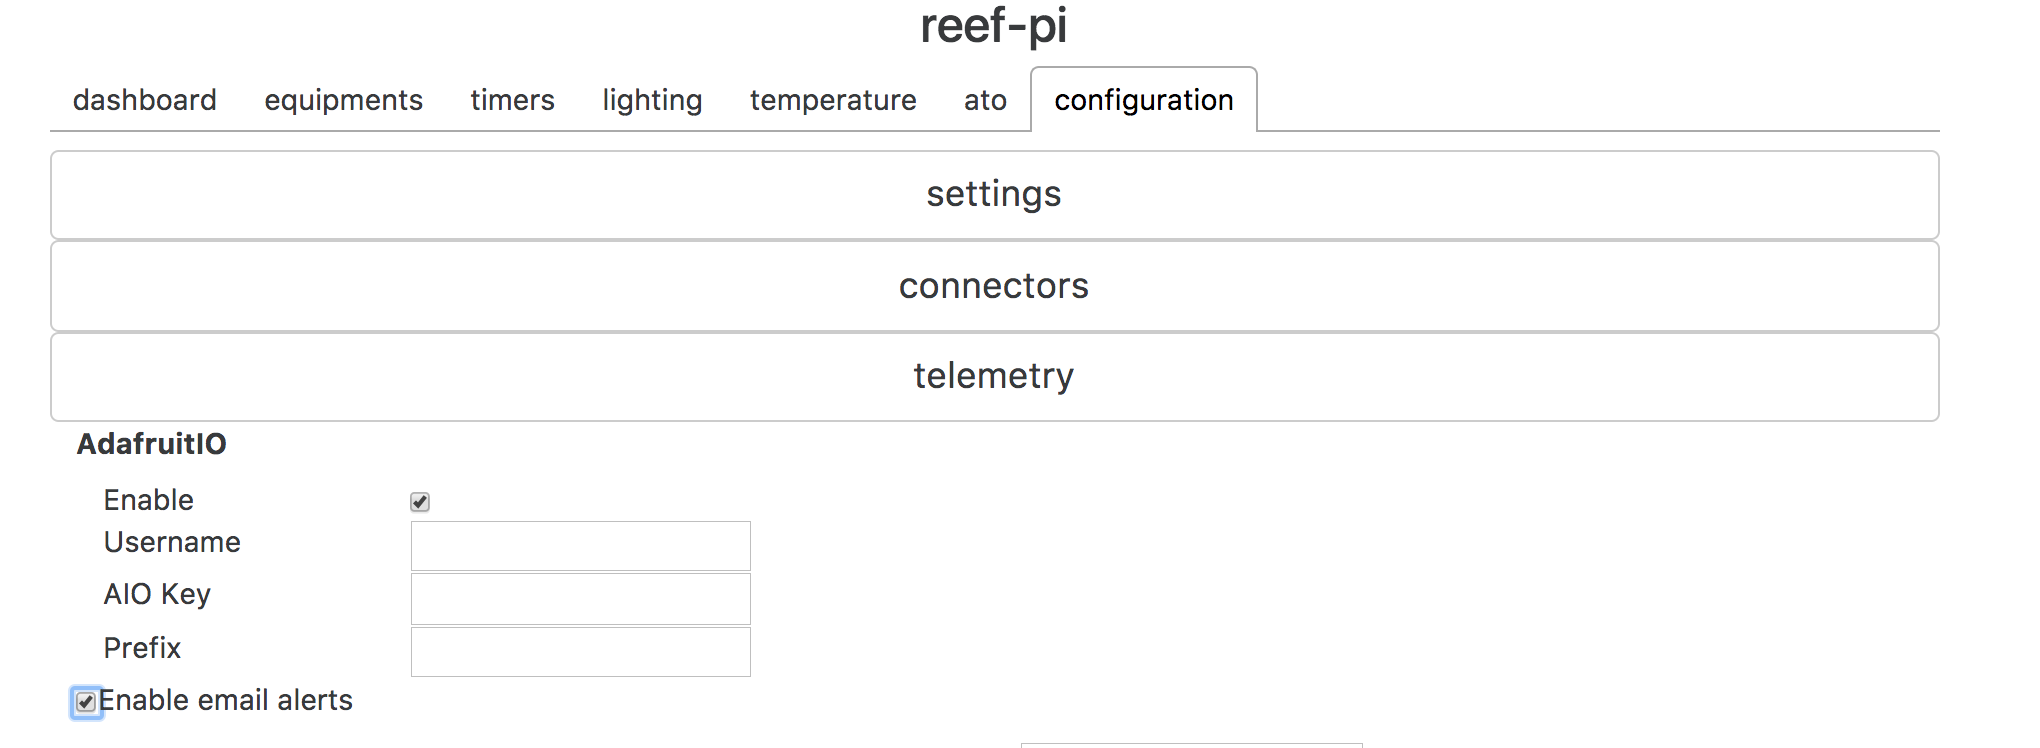
Next, enable telemetry in reef-pi under Configuration -> Telemetry tab. Select the Enable checkbox and specify adafruit.io username and AIO key. Click on update. And reload reef-pi.
After reload, reef-pi will start sending telemetry data to adafruit.io. reef-pi will automatically create specific feeds for temperature, equipment etc. Note, adafruit.io free accounts have feed number restrictions, other than per minute data limits. If you are building an all in one reef-pi controller and don’t have aio plus subscription, do not enable adafruit io integration or use a separate controller for power bar and lighting (and disable adafruit.io integration), that should significantly reduce the number of feeds required and data emitted from the sensor only controller.
Once data is available on adafruit.io website under individual feeds, you can build dashboards for your reef tank.
Setting up email alerts
Email alerts are useful when certain sensor data or controller health parameter (such as cpu and memory) goes out of normal range. Email notifications are enabled from Configuration -> Telemetry
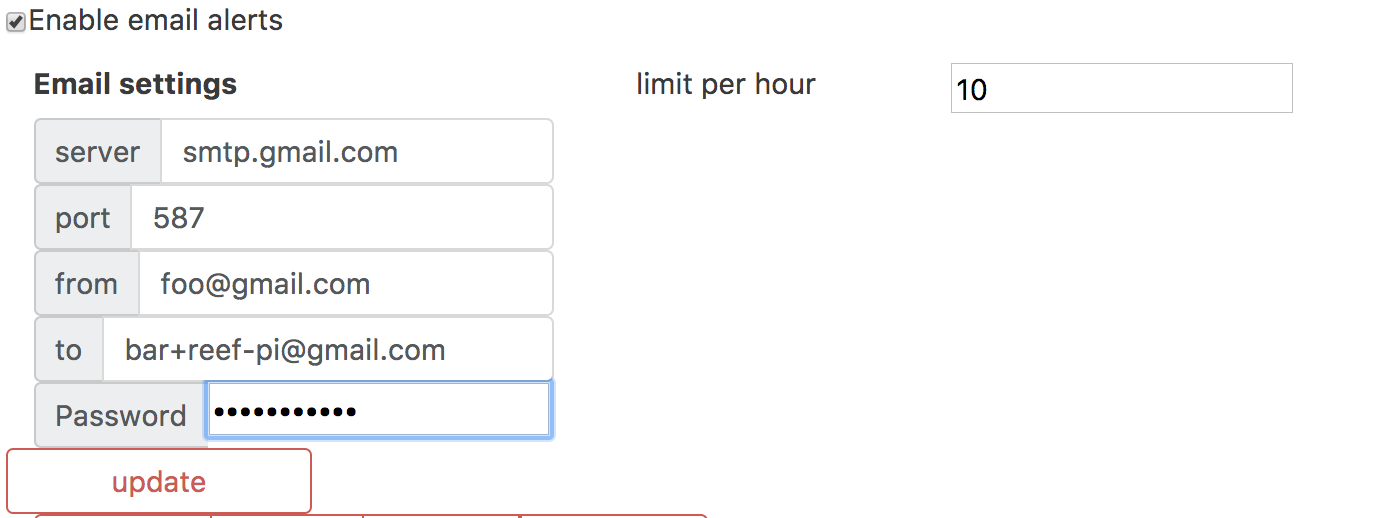
Enable notification under Configuration -> Telemetry tab. Select Enable email notification checkbox.
Once selected, email settings related fields will appear. Specify email server and username details. Click on the Update button.
By default, reef-pi will show gmail specific details. If you are a gmail user, you can obtain a password here. reef-pi also limits the number of alerts of individual types to a certain value (by default it is set to 10). Users can update this value as well.
That’s it. reef-pi is now configured to send email alerts. You can use individual module specific tabs (such as temperature or ato) to specify individual alert thresholds. Note: if alert is disabled from configuration tab, then reef-pi will not dispatch alert, even if alert thresholds are configured at individual modules or tabs.
Built-in dashboard
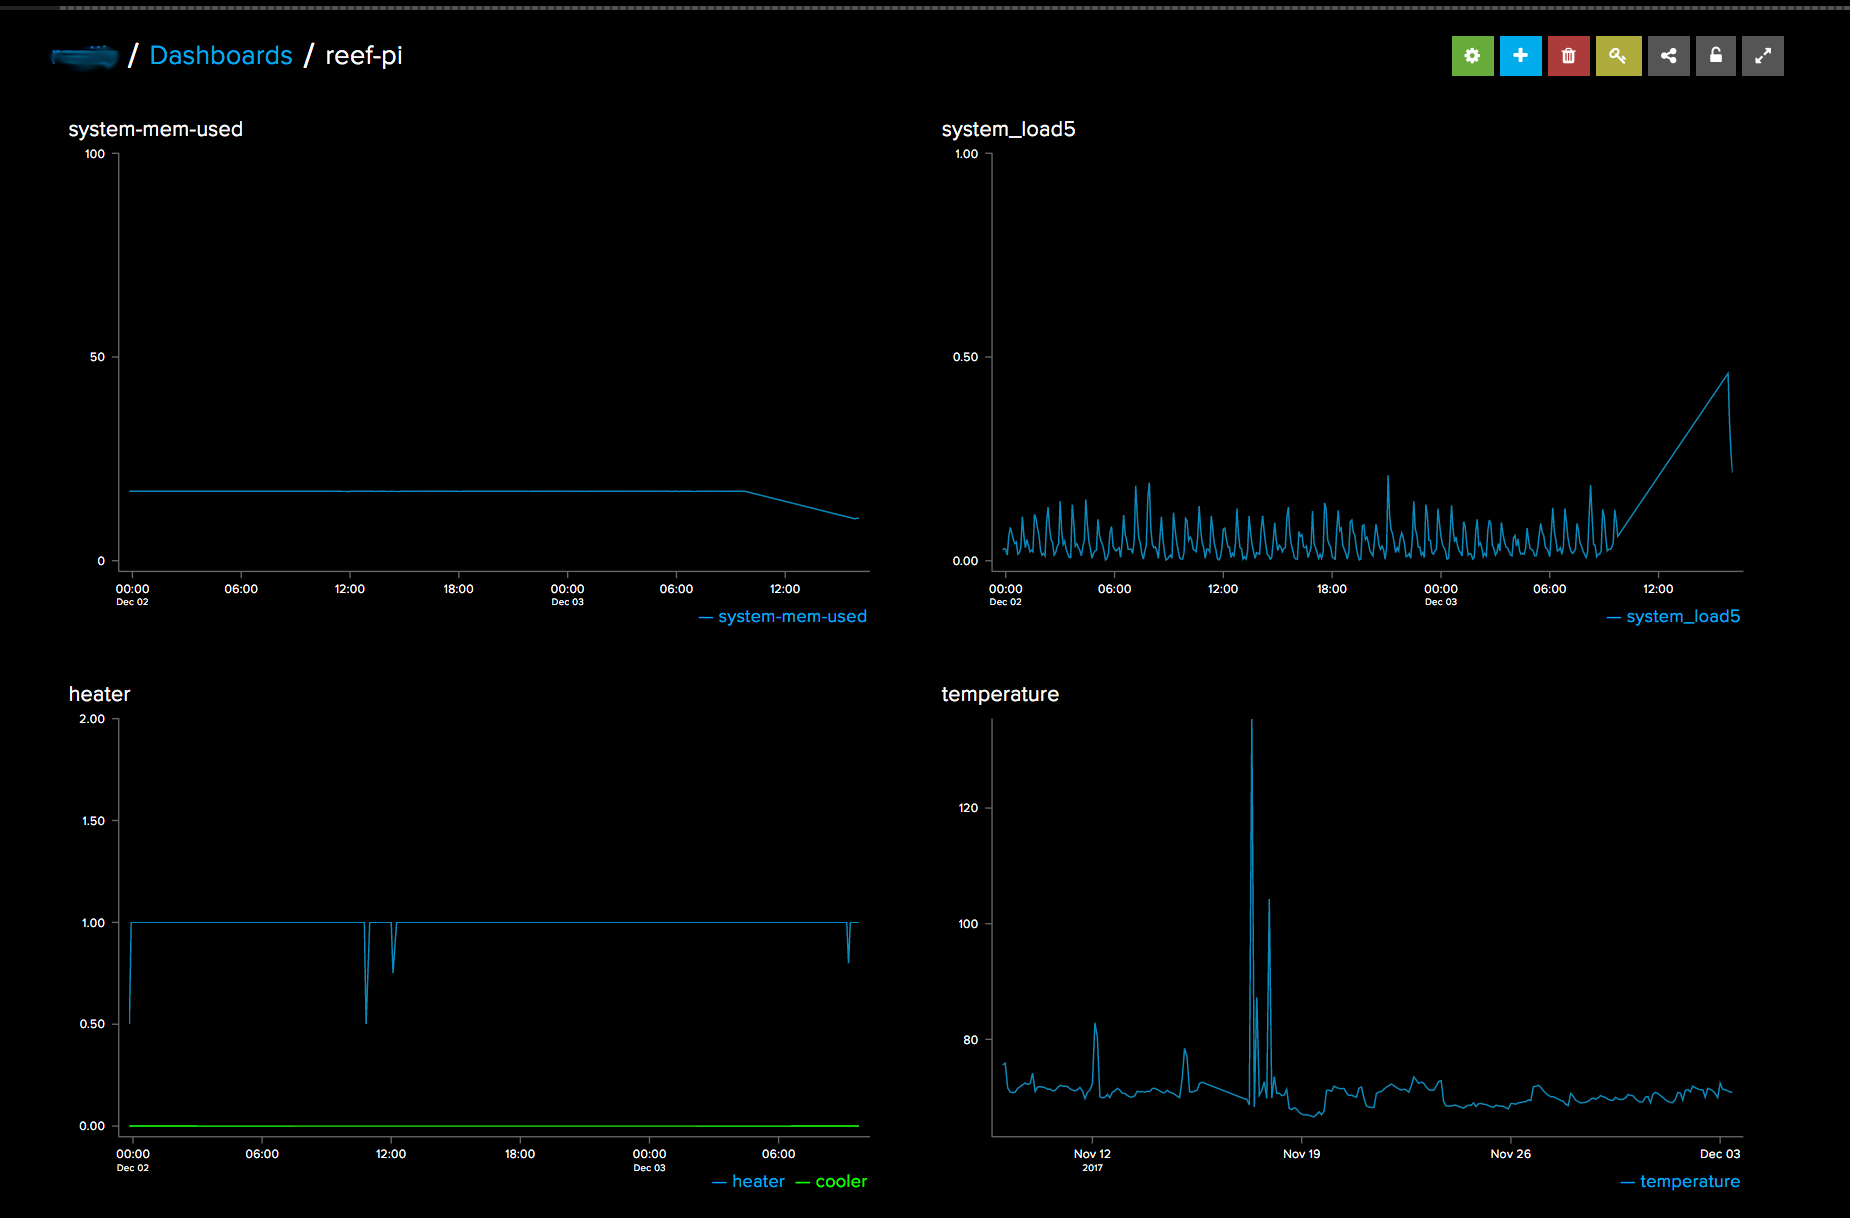
reef-pi comes with its own built-in dashboard that charts past seven days of telemetry data and few other relevant information. This data is transient and is lost everytime reef-pi is restarted. The dashboard reconfigures itself automatically based on the capabilities enabled (Configuration -> Settings -> Capabilities). Inside reef-pi dashboard feature itself modeled as a capability, and can be enabled or disabled from the configuration tab. Following is a brief overview of the charts provided in the dashboard and what they reflect:
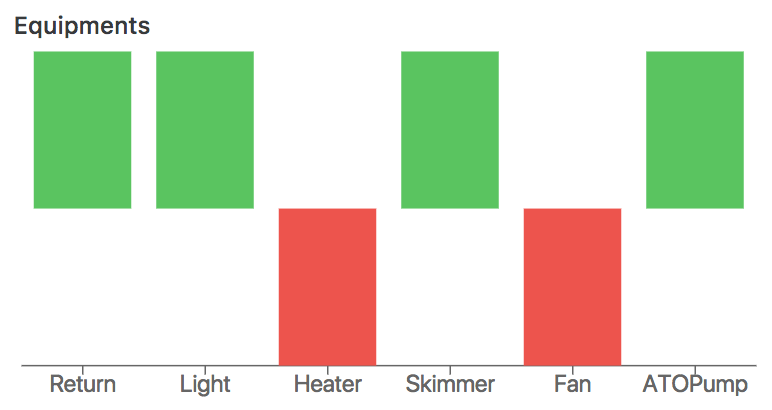
Equipment: The equipment chart is a bar chart where each vertical bar represents an individual equipment and the color of the bar indicates whether the equipment is on (green color) or off (gray).
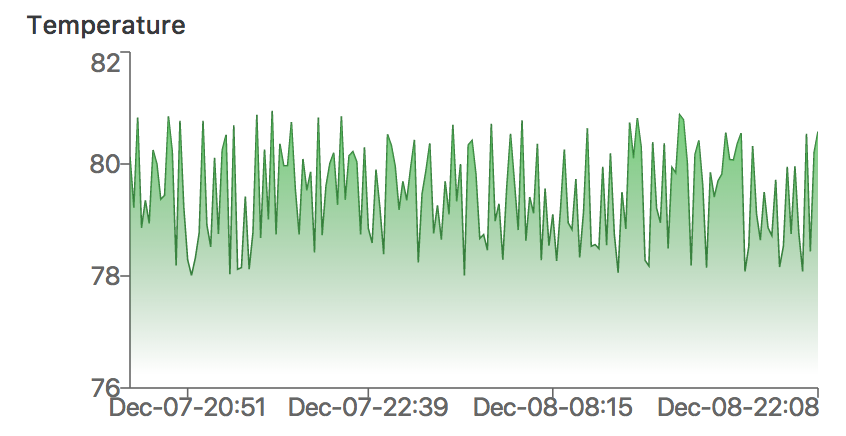
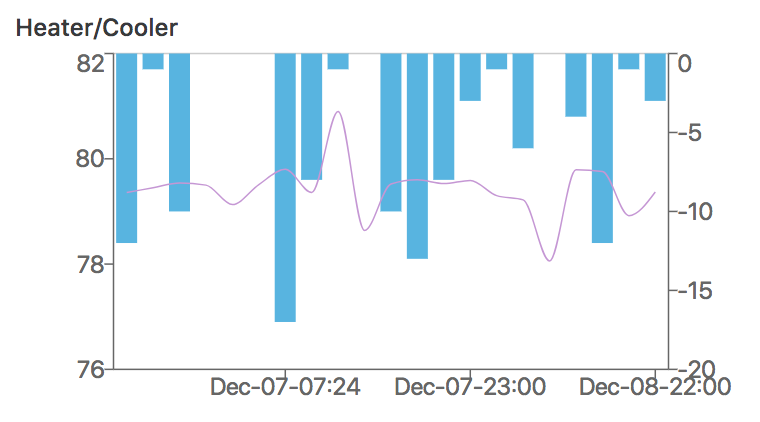
Temperature: There are two temperature chart in the dashboard. First one shows past 180 readings and the second one shows hourly usage of temperature control device (heater and cooler) for past seven days along with average temperature. If temperature controller is configured to check sensor after every one minute, the first chart will show last three hours temperature. Temperature charts help us understand temperature fluctuation in the tank as well as how efficient heater cooler device to adjust tank temperature. Temperature readings chart:
 Temperature controller equipment usage chart:
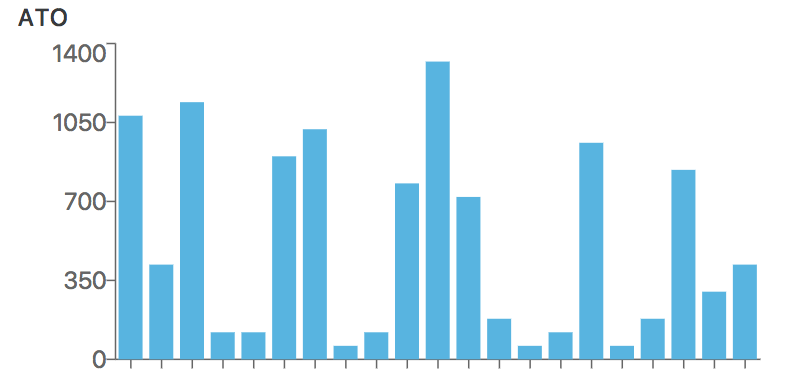
ATO: The ato chart shows hourly ato pump usage, where the usage metric stands for the total number of seconds ato pump was turned on. ATO chart can be used to understand the evaporation rate and ATO pumps capability to how quickly it can adjust the water level.
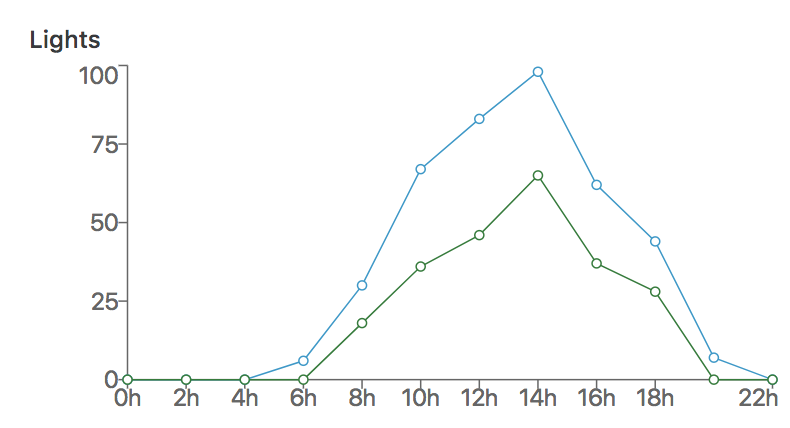
Lighting: The lighting charts are made of one chart for each light. Each chart has one line per channel lighting values. For fixed value lighting (i.e. lights that are not under day-light cycle or auto mode), these charts are not useful.
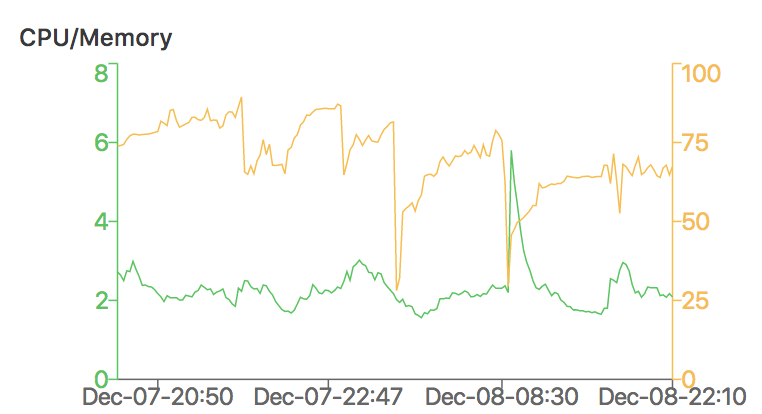
Controller health: This chart shows past seven days CPU and Memory usage of the controller. We recommend to run reef-pi under 1/3rd of the CPU/Memory usage. i.e. For Raspberry Pi 3 based controller normal CPU usage should not go above 0.3 and normal Memory usage should not go above 300 MB. This gives enough room for scenarios when the controller has to work harder, even with double workload, it will have 1/3rd of spare cpu/memory. Usually CPU and memory is usage increases with individual subsystem being enabled, higher number of equipment being controlled or higher frequency of sensor checks.